
Confidently Planning Workforce Deployment Forecasts
Workforce deployment forecast clearly explained: methods, data, key figures, and steps for better personnel planning.
You have a confirmed order, but the real planning is just beginning: How many guests will come, which roles do you need, what qualifications are required, and who might cancel at short notice? A duty roster that only copies past deployments can quickly become unrealistic for a concert, a hotel operation, or a security assignment.
A workforce deployment forecast first estimates the future personnel demand. It combines historical demand, seasonal patterns, confirmed orders, and available working hours. Then comes the concrete staffing. This separation helps you make assumptions visible and check before shift approval whether demand, personnel, qualifications, and working time rules fit together.
Table of Contents
- Why Forecasts Change Workforce Deployment
- Distinguishing Forecast, Scenario, and Shift Staffing
- Forecast Methods That Fit Your Business
- Data Sources That Show You Personnel Demand
- How to Conduct a Forecast up to Shift Planning
- Evaluating Forecast Errors and Operational Metrics Correctly
- Avoiding Typical Errors in Personnel Forecasting
- Bringing Your Forecast into the Next Planning Cycle
Why Forecasts Change Workforce Deployment
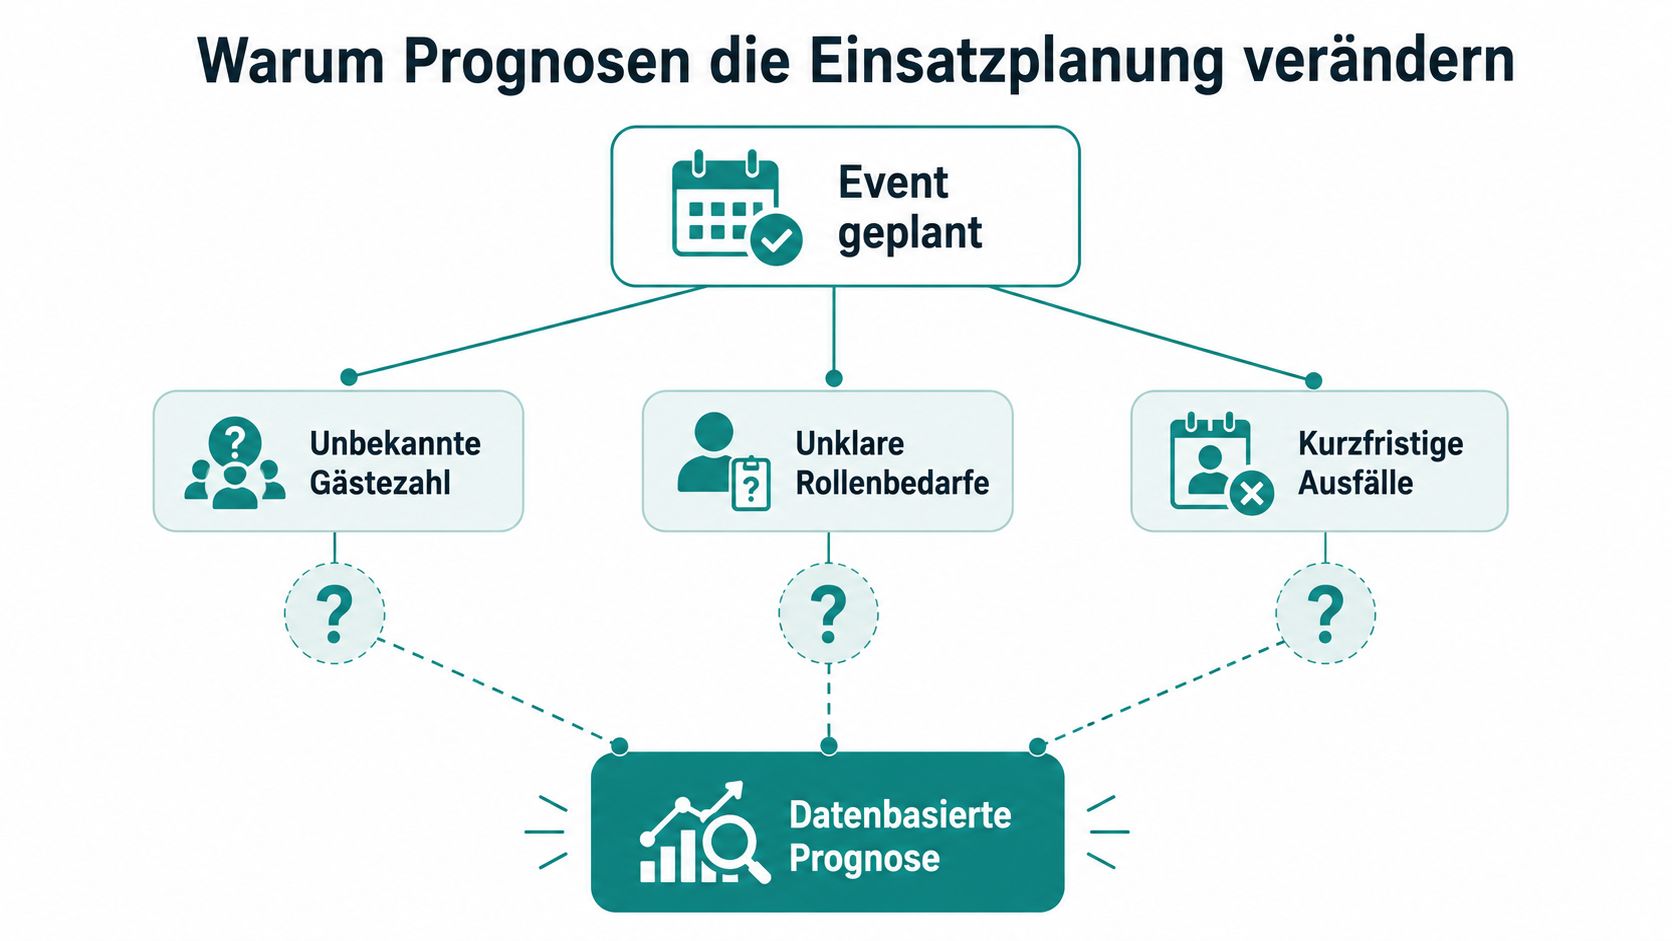
Imagine a hotel with a confirmed banquet. The reservation shows how many seats were sold but not yet when the peak rush will come, how many people are needed in service, or which employees have the necessary skills. A concert presents a similar challenge. The expected number of guests influences admission, bar service, cloakroom, cleaning, and security, but each role reacts differently to visitor flow.
For a security assignment, another point comes into play. Two locations can have the same deployment duration but require different posts, access rules, and qualifications. Simply looking at headcount is not enough there. You need an estimate by time window, role, location, and skill.
History Remains a Basis, Not the Whole Answer
Past deployments show how demand developed under similar conditions. However, they do not replace checking opening hours, weather, event type, booking status, confirmed orders, and reported availabilities. A previous concert can serve as a comparison if location, size, and schedule are similar. An additional VIP area or later admission still changes the demand.
For Switzerland, the actual working hours also matter. In 2022, the Federal Statistical Office recorded 7.922 billion working hours nationwide; in 2023, it was 8.106 billion. At the same time, the actual weekly working time of full-time employees ranged between 39 hours and 59 minutes and 40 hours and 12 minutes, depending on the comparison period. These figures show why you should consider not only employee numbers but also available hours and capacities. The Federal Statistical Office describes the development of working time.
| Question | Example | Result |
|---|---|---|
| How large is the demand? | Concert with confirmed ticket sales | Expected roles and hours |
| What can change? | More guests or additional access | Scenario with reserve demand |
| Who can take the deployment? | Service staff with suitable availability | Concrete assignment |
Practical rule: A forecast tells you how much work is likely to arise. It does not automatically say which person is allowed or able to perform this work.
Distinguishing Forecast, Scenario, and Shift Staffing
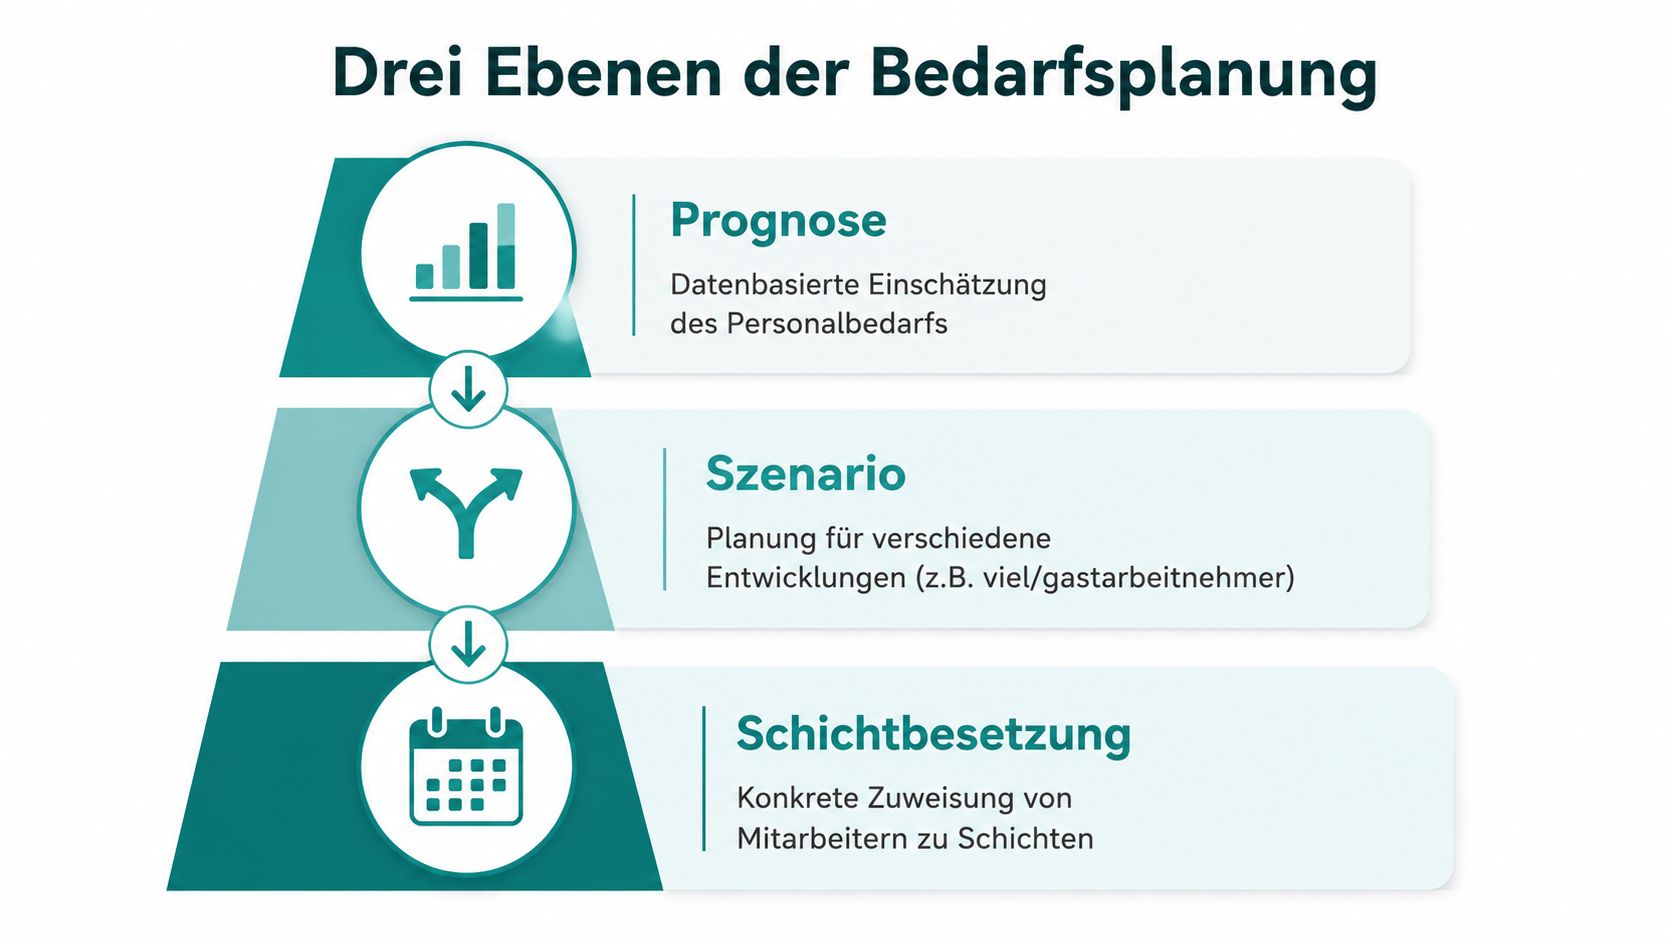
At a concert, these three levels are often mixed in one conversation. This leads to statements like: “We need ten people, so enter ten names.” This is exactly where mistakes happen because an estimate of demand is not yet a suitable staffing.
The forecast describes a reasoned expectation. You derive from similar events, the confirmed order, and the expected schedule how many people per role and time window might be needed. The result could be: more admission staff before the start, a constant number of security personnel during the event, and a smaller cleaning team afterward.
The scenario changes an assumption. For example, you calculate with stronger crowds, an additional security post, or a sick leave. The question is no longer “What do we expect?” but “What happens if this condition occurs?”
The Transition to the Concrete Person
Shift staffing only begins once the demand is established. Then you check role, qualification, availability, location, working time, and rest periods. If an assigned person cancels, the forecast initially remains unchanged. You need a new assignment or an alternative scenario, not automatically a new demand estimate.
A personnel pool makes this search more flexible because you can check several available people with matching characteristics. However, it does not fix a wrong demand estimate. If you plan too few hours for an additional order, the gap remains even if your pool is large.
| Level | Purpose | Typical Input |
|---|---|---|
| Forecast | Estimate expected demand | Historical deployments, order, season |
| Scenario | Check deviating conditions | More guests, absence, additional post |
| Shift Staffing | Assign people concretely | Qualification, availability, rest time |
A concert can thus result in a forecast with ten needed roles. With high crowds, a scenario with additional admission staff arises. In case of a cancellation, the staffing then answers which suitable person can take the open shift.
Forecast Methods That Fit Your Business
You don’t need a complicated model right away. The suitable method depends on how regular your processes are, how far ahead you plan, and which data you actually have.
Temporal Patterns for Recurring Processes
A hotel with similar early and late shifts can initially compare weekdays and times of day. If Monday mornings regularly have fewer tasks than weekends, this difference forms a simple planning basis. Such a method remains easy to explain and can be quickly aligned with the team’s experience.
Seasonal Patterns for Recurring Peaks
Seasonality helps with holidays, weddings, trade fairs, or event series. A gastronomy business does not treat a quiet winter day like a date during a known trade fair. You should check whether the pattern really recurs or if a single order distorts the series.
Regression Models for Explainable Influencing Factors
Regression examines the relationship between personnel demand and factors like opening time, order volume, or expected guests. A security service can check whether longer event times or additional entrances regularly trigger more posts. The model provides no useful answer if explanatory data is missing or inconsistently recorded.
Machine Learning for Many Interacting Signals
Machine learning can process several influences simultaneously. This fits better for businesses with many comparable deployments and sufficiently maintained data. For a small event company with few, very different orders, a comprehensible comparison calculation may be more sensible.
A simple method with a clean data basis is often more helpful than a hard-to-explain model with incomplete inputs.
For outdoor events, weather data can play a role if it demonstrably correlates with guest numbers or workload. Booking status can indicate demand early. Still, checking the concrete order remains necessary because a sold-out date does not generate the same demand in every role.
| Method | Good for | Requires |
|---|---|---|
| Temporal Patterns | Regular shifts | Time series by day and hour |
| Seasonal Patterns | Holidays, fairs, series | Comparable periods |
| Regression | Demand with explanatory factors | Order, opening, or visitor data |
| Machine Learning | Many interacting signals | Sufficient comparable and maintained data |
Data Sources That Show You Personnel Demand
A forecast becomes useful when it reflects your business’s signals. The sources don’t have to be extensive. They must fit the question you want to answer.
For event and promotion agencies, confirmed orders, event times, locations, expected visitor numbers, and past deployments belong together. Hotels and gastronomy combine reservations, banquet plans, opening hours, and seasonal demand. In healthcare, planned treatment or care capacities, roles, qualifications, and availabilities count. Security services need posts, shift times, locations, and special qualifications.
Don’t Omit Operational Data
Your own planning provides further signals:
- Hours worked: They show how much work actually occurred.
- Absences: They reveal whether a shift is regularly endangered by cancellations.
- Shift swaps: Frequent swaps can indicate unsuitable times or roles.
- Availabilities: They show which theoretical workforce is really ready for a time window.
- Assignment reasons: They explain why a person was not deployed.
Data protection belongs in the selection from the start. You should only use data needed for the planning decision, limit access, and check retention periods. For business processes with international contacts, a resource like Secure Bank Code Lookup can also be useful if payment or partner data must be clearly assigned.
For capacity considerations, you can use Personnel Capacity Planning at job.rocks as thematic guidance. It remains crucial to select the right signals per industry instead of throwing every available piece of information into a model.
| Industry | Typical Demand Signals | Important Qualification Features |
|---|---|---|
| Event and Promotion | Order, location, time, visitor count | Role, customer requirements, product training |
| Hotel and Gastronomy | Reservation, banquet, opening | Service, kitchen, shift capability |
| Healthcare | Care capacity, treatment plan | Specialist role, license, experience |
| Security | Post, access, location, duration | Permit, language skills, site knowledge |
How to Conduct a Forecast up to Shift Planning
Don’t start with the model but with the decision. Do you want to estimate person-hours for the coming week, plan roles for an event, or identify long-term bottlenecks per location? Without a clear unit, two teams can interpret the same number differently.
Six Steps from Order to Plan
- Define goal and period: Specify whether you need hours, persons, or roles for a day, week, or event.
- Organize data sources: Separate confirmed orders from uncertain assumptions and note where availabilities and qualifications are stored.
- Clean data: Check for missing values, duplicate deployments, shift swaps, and unusual outliers.
- Select method: Start with the understandable method your data supports. A more complex variant needs a clear comparison.
- Check with time lag: Compare the estimate with later periods, not just data the model already knows.
- Hand over to shift planning: Transfer demand by role and time window. Then check persons, availability, qualification, breaks, rest periods, and cancellations.
Take a confirmed event. You mark the order as a fixed signal, compare similar events, and create a scenario for higher crowds. Then you hand over demand for admission, service, and security to shift planning. Only there is it checked whether the proposed persons are available on site and have the required skills.
Labor law limits belong in this final check step, not as a subsequent correction. The daily rest period is generally at least 11 consecutive hours. For adult employees, it may be reduced once a week to 8 hours if an average of 11 hours is reached over two weeks. SECO explains the rules on working and rest times.
Breaks must also be included in the plan. For more than 5.5 hours of work, 15 minutes are required; for more than 7 hours, 30 minutes; and for more than 9 hours, 60 minutes. The SECO guide on breaks shows why a long event shift cannot simply be entered without interruption.
Software like AI-based workforce deployment from job.rocks can be considered in a comparison of existing tools. For your review, it is still important to clearly distinguish which values come from a forecast and which decision is approved by a responsible person.
| Phase | Check Question | Result |
|---|---|---|
| Goal | Which unit is estimated? | Persons, roles, or hours |
| Data | Which signals are reliable? | Cleaned inputs |
| Model | Is the method understandable? | Comparable forecast |
| Check | How large is the deviation? | Suitable scenarios |
| Handover | Which roles need persons? | Demand per time window |
| Approval | Are rules and persons checked? | Deployment-ready shift |
Evaluating Forecast Errors and Operational Metrics Correctly
A forecast can be mathematically close to reality and still produce a poor duty roster. If ten normal shifts fit but a large security assignment is misjudged, you feel the error in the open role, last-minute cancellations, and overtime.
For the model, you can consider the absolute deviation. It shows how far the estimate was from actual demand. The mean absolute error summarizes these deviations over several periods. Coverage asks how often demand could be met by suitable persons at all.
Separating Model Quality and Planning Quality
An overall value can hide local problems. Values should be evaluated by period, location, and qualification. A forecast may fit hotel early shifts but be too low for weekend banquets. A security service may have enough staff at one location but lack a specific qualification at another.
For the business, besides model values, also count:
- Unfilled roles: Which tasks remained open?
- Last-minute cancellations: How often was the plan changed afterward?
- Overtime: Where did additional effort arise?
- Hours worked: How much did actual work deviate from the plan?
- Occupancy rate: Which planned roles were staffed with suitable persons?
- Unplanned shift changes: How often did the team have to rearrange at short notice?
Measurement rule: Save forecast, scenario, approved plan, and actual result together. Only this comparison shows whether the cause lay in demand, availability, or assignment.
Business Intelligence from job.rocks can serve as a reference if you want to compare reports on staffing, availability, and bottlenecks. Start with few key figures and observe them over several planning cycles. This way, you recognize whether a change really helps or only reflects a single special case.
| Metric | What it shows | What it does not show alone |
|---|---|---|
| Absolute deviation | Distance between estimate and reality | Why the distance occurred |
| Mean absolute error | Average model deviation | Whether rare large orders are well planned |
| Coverage | Share of fulfilled demands | Whether qualification was suitable |
| Unfilled roles | Open tasks in plan | Whether demand was wrong or pool too small |
| Overtime | Additional working time | Whether cause was demand or assignment |
Avoiding Typical Errors in Personnel Forecasting
Many errors occur before calculation. A short history may provide too few comparisons. A long series can be misleading if opening hours, processes, or order types have changed.
A confirmed order does not belong in the same uncertainty bucket as a possible inquiry. A single extraordinary large order must not automatically make a seasonal peak the new normal value. And an average across all locations can hide a local gap.
Check Every Assumption
- Data status: Is it clear until when orders and availabilities were recorded?
- Comparability: Do previous deployments match the new order in location, size, and schedule?
- Scenarios: Is there a variant for higher demand and for absences?
- Roles: Is demand calculated by skill rather than just headcount?
- Approval: Does a responsible person check the transition from demand to staffing?
- Working time: Are rest periods, breaks, and recording obligations considered?
Swiss working time recording has known exceptions since January 1, 2016 under Articles 73a and 73b of Ordinance 1 to the Labor Act. SECO describes working time recording, while the canton of Zurich points to systematic recording and retention of at least five years. Your planning system must therefore distinguish between fully recorded times and permitted exceptions.
| Error | Consequence | Countermeasure |
|---|---|---|
| Combining all locations | Local gaps remain invisible | Evaluate locations separately |
| Mixing order and assumption | Demand becomes too uncertain or high | Clearly mark signals |
| Ignoring qualification | Headcount fits, role remains open | Check role filters before staffing |
| Treating outliers as rule | Seasonal pattern is distorted | Mark special cases |
| Checking rules only at the end | Shifts must be changed afterward | Check rest and breaks before approval |
Bringing Your Forecast into the Next Planning Cycle
Choose a manageable use case. An event links order, visitor count, and roles. A hotel shows the connection between reservations and early or late shifts. A care service reveals qualification bottlenecks, while a security service exposes location differences.
First separate forecast, scenario, and staffing. Then choose the simplest method your data supports. Before approval, check deviation, open roles, qualifications, availabilities, rest periods, breaks, and last-minute cancellations.
| Check Step | Done When |
|---|---|
| Define demand | Role, period, and unit are set |
| Check data | Orders, history, and availabilities are separated |
| Form scenarios | Deviations and absences are visible |
| Check staffing | Persons, qualifications, and times fit |
| Measure result | Plan and actual deployment are compared |
The Swiss labor market situation makes this separation especially relevant. For 2023, over 200,000 unfilled positions were forecast, for 2025 around 365,000. Healthcare accounted for 17% of open positions, construction and hospitality each 13%. The underlying presentation on the skilled labor shortage shows why an available personnel pool is differently resilient depending on industry and qualification.
Start with one location, one role, or one recurring deployment type. Define who maintains the data, who checks scenarios, and who approves the shift. After the first cycles, expand the scope only where measurement shows real planning benefit.
job.rocks bundles shifts, deployments, roles, and locations and supports selecting suitable employees by availability and qualification. Visit job.rocks if you want to connect your forecast with concrete workforce deployment and available personnel pools.